Graph Between Applied Force And The Force Of Friction
When studying the interaction between objects, the relationship between applied force and the force of friction is fundamental. Friction is the resistive force that opposes the motion of an object when it moves across a surface. The graph between the applied force and the force of friction reveals how friction responds as more force is applied, often showing initial static friction that must be overcome before the object begins to move. In real life, this concept is evident when pushing a heavy piece of furniture across a floor. Initially, a greater force is required to overcome static friction and get the object moving, but once in motion, the force needed to keep it moving (overcoming kinetic friction) is generally less. Understanding this relationship is crucial not only in physics but also in everyday activities such as driving, where friction between the tyres and the road determines how effectively a car can accelerate or stop.
This Story also Contains
- Graph Between Applied Force and the Force of Friction
- Solved Examples Based on Graph Between Applied Force and the Force of Friction
- Summary
Graph Between Applied Force and the Force of Friction
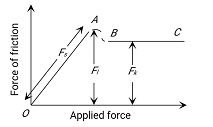
The relationship between applied force and the force of friction is a key concept in understanding how objects interact with surfaces. Friction is the force that resists the motion of one surface over another, and it plays a crucial role in our daily lives. For instance, when you push a heavy object, like a sofa, across a room, you experience the force of friction firsthand. Initially, you need to apply a significant amount of force to overcome static friction and get the object moving. Once the object is in motion, the force required to keep it moving—overcoming kinetic friction—tends to be lower. The graph depicting this relationship typically shows a rise in friction up to the point where the object starts to move, after which the friction force stabilizes.

At A static friction is the maximum
OA = Represents static friction
Beyond A, the force of friction decreases slightly
2.

The angle between the normal reaction and resultant contact force is called the angle of friction $(\theta)$.
$\begin{aligned} & \tan \theta=\frac{F_l}{R} \\ & \tan \theta=\mu_s \\ & \frac{F_l}{R}=\mu_s \\ & \mathrm{R}=\text { Reaction, } \\ & F_l=\text { Force of limiting friction } \\ & \theta=\tan ^{-1}\left(\mu_s\right)\end{aligned}$
3.

$
\begin{aligned}
& S=\sqrt{F^2+R^2} \\
& S=\sqrt{(\mu m g)^2+(m g)^2} \\
& S=m g \sqrt{\mu^2+1} \\
& \mathrm{~S}=\text { Resultant force } \\
& \mu=\text { Coefficient of friction }
\end{aligned}
$
If $\mu=0, \mathrm{~S}$ (will be minimum), $\therefore \mathrm{S}=\mathrm{mg}$
Recommended Topic Video
Solved Examples Based on Graph Between Applied Force and the Force of Friction
Example 1: Mark the correct statement about friction between two bodies
a) static friction is always greater than kinetic friction
b) The coefficient of static friction is always greater than the coefficient of kinetic friction
c) limiting friction is always greater than kinetic friction
d) limiting friction is never less than static friction
1) b,c,d
2) a,b,c
3) a,c,d
4) a,b,d
Solution:
The graph between Applied Force and Force of Friction
wherein
At A static friction is maximum.
OA = Represents static friction
* Beyond A force of friction decreases slightly

Hence, the answer is the option (1).
Example 2: A force of 100N is just sufficient to pull a block of mass $10 \sqrt{3}$ kg on a rough horizontal surface. What is angle friction? (g=10m/s2)
1) $30^{\circ}$
2) $45^{\circ}$
3) $60^{\circ}$
4) $50^{\circ}$
Solution:
Given
Applied force, $F=100 \mathrm{~N}$
Mass of the block, $m=100 \sqrt{3} \mathrm{~kg}$
As the Force F is just sufficient to pull the block, it must be equal to the limiting friction force.
F.B.D of the block-

$
\begin{aligned}
& N=m g \\
& f_l=F
\end{aligned}
$
Angle of friction $(\theta)$ is defined as-
$
\begin{aligned}
& \tan \theta=\frac{f_l}{N} \\
& \theta=\tan ^{-1} \frac{F}{N}=\frac{100}{100 \sqrt{3}} \\
& \Rightarrow \theta=30^{\circ}
\end{aligned}
$
Hence, the answer is the option (1).
Example 3: A block is placed on a rough horizontal plane. A time-dependent horizontal force $F=k t$ acts on the bock, where k is a positive constant. The acceleration - time graph of the block is :
1)

2)

3)

4)

Solution:
As the block is placed on a rough surface there will act static friction on it will attain its maximum value. After that, the block will start to slide on the surface with acceleration increasing with time.
1) the equation for the block when it is static $\left(\right.$ i.e $\left.t \leq \frac{\mu m g}{k}\right)$
$
\begin{aligned}
& k t=f s \\
& a=0
\end{aligned}
$
2) After it starts sliding $\left(\right.$ i.e $\left.\quad t>\frac{\mu m g}{k}\right)$
$
\begin{aligned}
& k t-\mu m g=a \\
& \frac{d a}{d t}=k
\end{aligned}
$
Hence, the answer is the option (2).
Example 4: Which of the following options correctly describes the variation of the speed v and acceleration ‘a’ of a point mass falling vertically in a viscous medium that applies a force F =−kv, where ‘k’ is a constant, on the body? (Graphs are schematic and not drawn to scale)
1)

2)

3)

4)

Solution:
When the pt. mass will start falling its initial velocity will be O & have maximum acceleration. After the mass has a steady state velocity a = 0 the variation is exponential.
Hence, the answer is the option (2).
Summary
The relationship between applied force and friction is crucial in understanding how objects interact with surfaces. Initially, a significant force is required to overcome static friction and get an object moving, after which the force of friction decreases slightly as it transitions to kinetic friction. This concept is reflected in real-life scenarios like pushing furniture, where the graph shows a peak in friction before movement begins. Understanding this relationship helps in analyzing forces in various practical situations, such as determining the angle of friction or calculating the force needed to move objects on rough surfaces.
Frequently Asked Questions (FAQs)