Graphs of General Trigonometric Functions
Understanding the graphs of general trigonometric functions is an essential part of trigonometry. These graphs, such as those of sine, cosine, and tangent, help us see how each function behaves as the input angle varies. By analyzing these curves, we can understand key properties like amplitude, period, phase shift, and vertical shift. These elements show how the graph stretches, moves, or flips on the coordinate plane. Graphing trigonometric functions is not only important for Class 11 Maths and CBSE board exams but also plays a vital role in JEE preparation. These graphs are widely used in real-life scenarios involving waves, circular motion, and repeated patterns. In this article, we will learn in depth about the graphs of trigonometric functions, their domain, and range, along with solved examples.
Introduction to Graphs of Trigonometric Functions
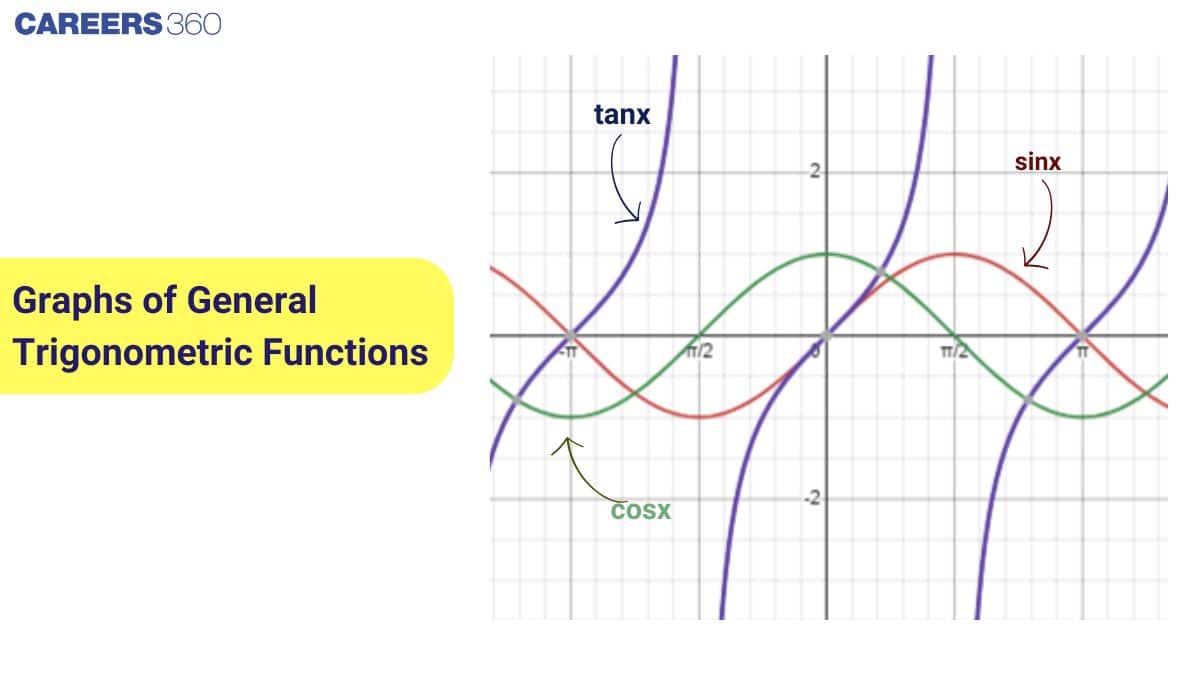
Graphs of general trigonometric functions like $\sin x$, $\cos x$, and $\tan x$ show wave-like patterns that repeat, helping us understand amplitude, periodicity, and phase shift. Mastering the sine, cosine tangent graphs and other trigonometric functions graphs is essential for Class 11 Maths and exams like JEE.
What Are Trigonometric Function Graphs?
Trigonometric function graphs are visual representations of how functions like $\sin x$, $\cos x$, and $\tan x$ change with angle. These graphs of trigonometric functions reveal wave-like patterns, turning points, symmetry, and periodicity of trigonometric functions, which are difficult to grasp through numbers alone.
Understanding the sine, cosine, tangent graphs and other forms like the graph of sec, cosec, cot functions allows us to see how each function behaves across different intervals. By studying the graph of sin(x), cos(x), tan(x) and their shifted trig function graphs, we can better analyse amplitude and phase shift in trigonometry. These are key elements in interpreting the graphs of general trigonometric functions.
So, why do we graph trigonometric functions? Because visualising them on the coordinate plane helps answer questions like how do transformations affect trig graphs? Which trigonometric function has asymptotes? It also deepens our understanding of the general form of trigonometric functions and guides us on how to draw trigonometric graphs accurately.
Standard Graphs of Sine, Cosine, and Tangent Functions
The graphs of $\sin x$, $\cos x$, and $\tan x$ are the most common trigonometric function graphs. These functions repeat in regular intervals, creating wave-like patterns that illustrate the periodicity of trigonometric functions. Understanding their shapes,and how they fit into the broader category of graphs of general trigonometric functions,helps students solve trigonometric equations, analyse periodic behaviour, and prepare for board exams and competitive tests like JEE.
Graph of Sine Function ($\sin x$)
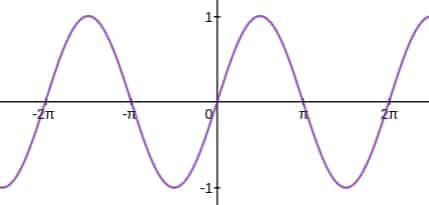
The graph of $\sin x$ is a smooth, continuous wave that starts at the origin. It has a period of $2\pi$, an amplitude of $1$, and oscillates between $-1$ and $1$. It repeats every $2\pi$, forming a regular sine curve and serving as one of the fundamental examples within the graphs of general trigonometric functions.
Sine is the ratio of the length of the opposite side (perpendicular) to the length of the hypotenuse with respect to a given angle.
$y=f(x)=\sin x$
In the graph of sine functions, the values of the angle are taken on the $x$-axis, while the corresponding values of $y = \sin x$ are plotted on the $y$-axis.
Domain: $\mathbb{R}$
Range: $[-1, 1]$
$\sin x$ completes one full cycle (from $-1$ to $1$) over an interval of length $2\pi$.
So, Period: $2\pi$
The graph drawn over the interval $[0, 2\pi]$ repeats to both the right and left.
The roots (zeroes) of the sine function occur at: $x = n\pi$, where $n \in \mathbb{Z}$
Minimum value: $\sin x = -1$ at $x = \dfrac{3\pi}{2}$
Maximum value: $\sin x = 1$ at $x = \dfrac{\pi}{2}$
Amplitude: $1$
Since $\sin(-x) = -\sin x$, the function is odd, and its graph is symmetric about the origin.
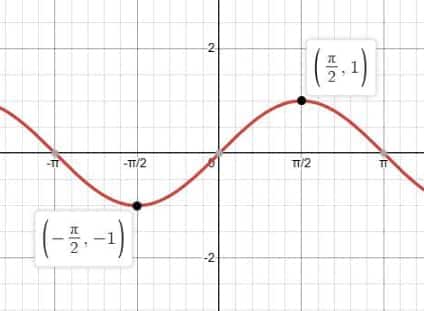
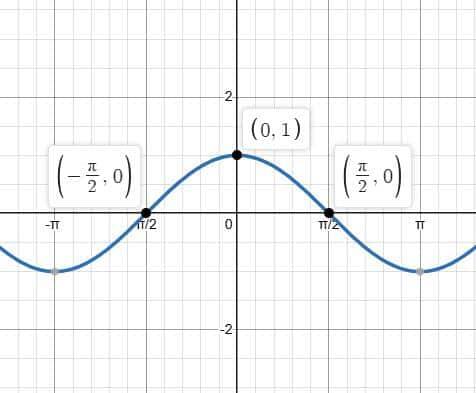
Graph of Cosine Function ($\cos x$)
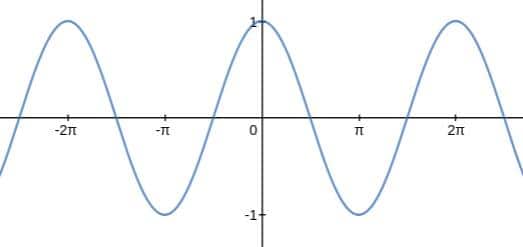
The graph of $\cos x$ looks like the sine graph but starts at its maximum value. It also has a period of $2\pi$ and an amplitude of $1$. The wave pattern repeats in cycles and helps us visualize how cosine values change with angle, making it a key example in the graphs of general trigonometric functions.
Cosine is defined as the ratio of the length of the adjacent side (base) to the length of the hypotenuse for a given angle.
$y = f(x) = \cos x$
In the graph of the cosine function, the angle values are taken along the $x$-axis, and the corresponding values of $y = \cos x$ are plotted on the $y$-axis.
We use the identity:
$\sin(x + 90^\circ) = \cos x$
This means the graph of $\cos x$ is the same as the graph of $\sin x$, but shifted to the left by $90^\circ$ (or $\dfrac{\pi}{2}$ radians).
Domain: $\mathbb{R}$
Range: $[-1, 1]$
$\cos x$ completes one full cycle in an interval of length $2\pi$, so:
Period: $2\pi$
The roots of $\cos x$ are at:
$x = \dfrac{(2n + 1)\pi}{2}$, where $n \in \mathbb{Z}$
Minimum value: $\cos x = -1$ at $x = \pi$
Maximum value: $\cos x = 1$ at $x = 0, 2\pi, 4\pi$
Amplitude: $1$
Line of symmetry: $y$-axis
Since $\cos(-x) = \cos x$, the function is even, and the graph is symmetric about the $y$-axis.
What are the characteristics of the graphs of trigonometric functions? What are the properties of the graphs of sin x and cos x? The graphs of sin x and cos x are both periodic. They repeat every 360° (2π radians) The angle will always be on the x-axis.
Graph of Tangent Function ($\tan x$)
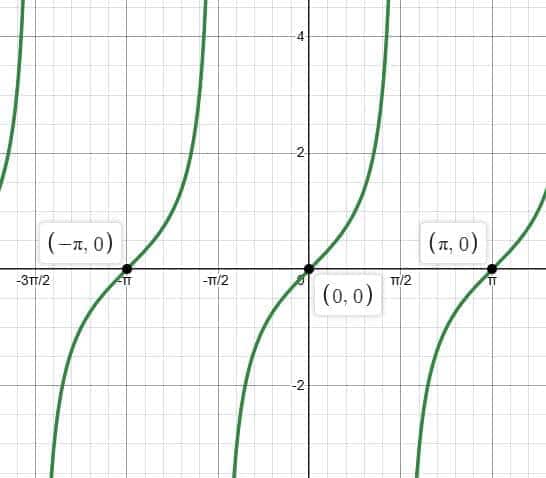
The graph of $ \tan x $ is different from sine and cosine. It has vertical asymptotes at $ x = \frac{\pi}{2} + n\pi $ and repeats every $ \pi $. The graph increases sharply and passes through the origin, making it useful for understanding discontinuities and rapid changes.
The tangent function is defined as the ratio of the length of the opposite side (perpendicular) to the length of the adjacent side (base) for a given angle.
$y = f(x) = \tan x$
In the graph of the tangent function, the values of the angle (in radians or degrees) are taken along the $x$-axis, while the corresponding values of $y = \tan x$ are plotted on the $y$-axis.
Domain: $\mathbb{R} - \left\{ \dfrac{(2n+1)\pi}{2} \,\middle|\, n \in \mathbb{Z} \right\}$
Range: $\mathbb{R}$
Period: $\pi$ (or $180^\circ$)
The function $\tan x$ increases continuously in each interval such as:
$(-\dfrac{3\pi}{2}, -\dfrac{\pi}{2})$, $(-\dfrac{\pi}{2}, \dfrac{\pi}{2})$, $(\dfrac{\pi}{2}, \dfrac{3\pi}{2})$, etc.
The graph passes from negative infinity to positive infinity between the vertical asymptotes.
The roots of $\tan x$ are at:
$x = n\pi$, where $n \in \mathbb{Z}$
Amplitude: Not defined (since the graph has no maximum or minimum value,it extends to $\pm \infty$)
Line of symmetry: Origin (graph is symmetric with respect to the origin)
Since: $\tan(-x) = -\tan x$, the function is odd, and its graph is symmetric about the origin.
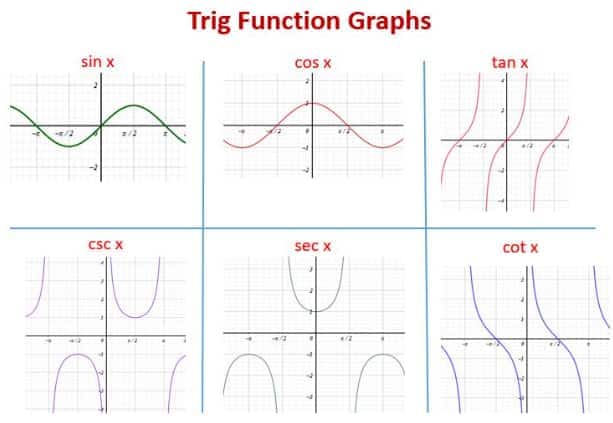
Graphs of Reciprocal Trigonometric Functions
Reciprocal trigonometric functions,$ \csc x $, $ \sec x $, and $ \cot x $ have unique graphs. They include vertical asymptotes and are defined where their base functions ($ \sin x $, $ \cos x $, $ \tan x $) are non-zero. These graph of sec, cosec, cot functions are important for solving advanced trigonometric problems and understanding undefined values.
Graph of Cosecant Function ($\csc x$)
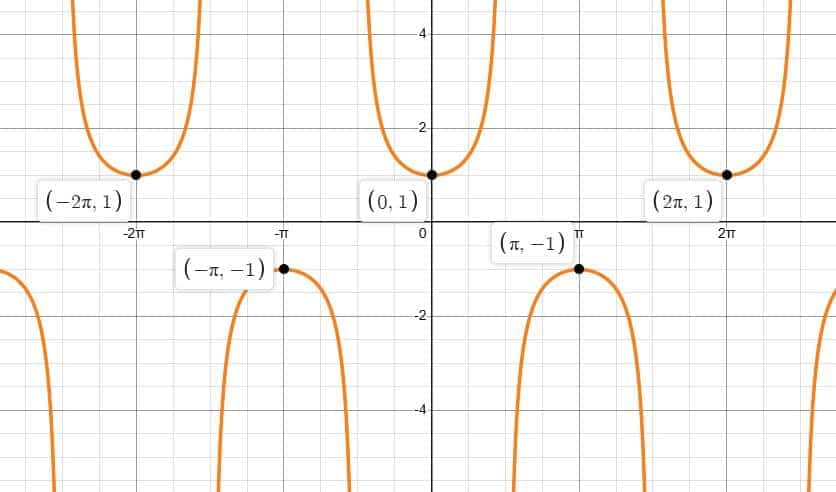
The graph of $ \csc x = \frac{1}{\sin x} $ has vertical asymptotes wherever $ \sin x = 0 $, i.e., at $ x = n\pi $. It forms a series of upward and downward curves that never touch the x-axis. This graph is useful for analyzing undefined behavior in trigonometric ratios.
Cosecant is defined as the ratio of the length of the hypotenuse to the length of the opposite side (perpendicular) for a given angle.
$y = f(x) = \csc x$
In the graph of the cosecant function, the angle values are taken on the $x$-axis, while the corresponding values of $y = \csc x$ are plotted along the $y$-axis.
Domain: $\mathbb{R} - \left\{ n\pi \,\middle|\, n \in \mathbb{Z} \right\}$
Range: $(-\infty, -1] \cup [1, \infty)$
Period: $2\pi$
The graph has vertical asymptotes at $x = n\pi$ due to undefined values of $\csc x$ at those points.
The function repeats its shape every $2\pi$ interval.
Amplitude: Undefined (as the curve does not have a fixed maximum or minimum; it tends to infinity)
Line of symmetry: Origin
Since: $\csc(-x) = -\csc x$
the function $\csc x$ is an odd function.
Graph of Secant Function ($\sec x$)
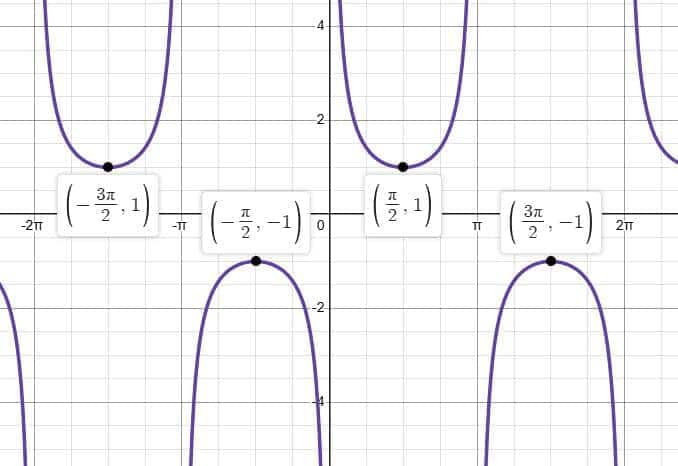
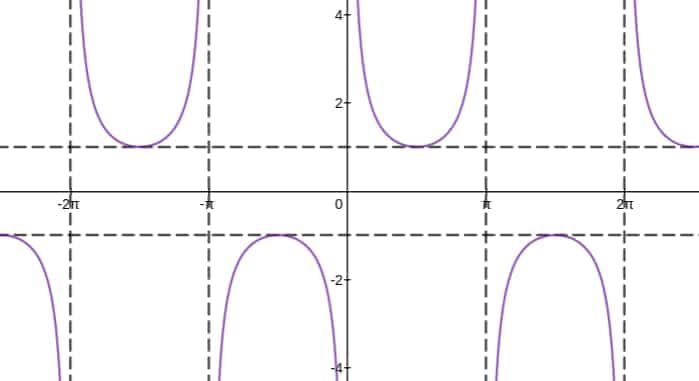
The graph of $ \sec x = \frac{1}{\cos x} $ is similar to $ \csc x $, with asymptotes at $ x = \frac{\pi}{2} + n\pi $. The curves are U-shaped and mirror the shape of the cosine function’s reciprocal. It helps in understanding inverse wave behavior.
Secant is defined as the ratio of the length of the hypotenuse to the length of the adjacent side (base) for a given angle.
$y = f(x) = \sec x$
In the graph of the secant function, angle values are placed on the $x$-axis, and the corresponding values of $y = \sec x$ are plotted along the $y$-axis.
Domain: $\mathbb{R} - \left\{ \frac{(2n+1)\pi}{2} \,\middle|\, n \in \mathbb{Z} \right\}$
Range: $(-\infty, -1] \cup [1, \infty)$
Period: $2\pi$
The function repeats its curve every $2\pi$ interval.
Vertical Asymptotes: $x = \frac{(2n+1)\pi}{2}$ where $n \in \mathbb{Z}$
Amplitude: Undefined (since the graph extends infinitely in both directions)
Line of Symmetry: $y$-axis
Since: $\sec(-x) = \sec x$, the function $\sec x$ is an even function.
Graph of Cotangent Function ($\cot x$)
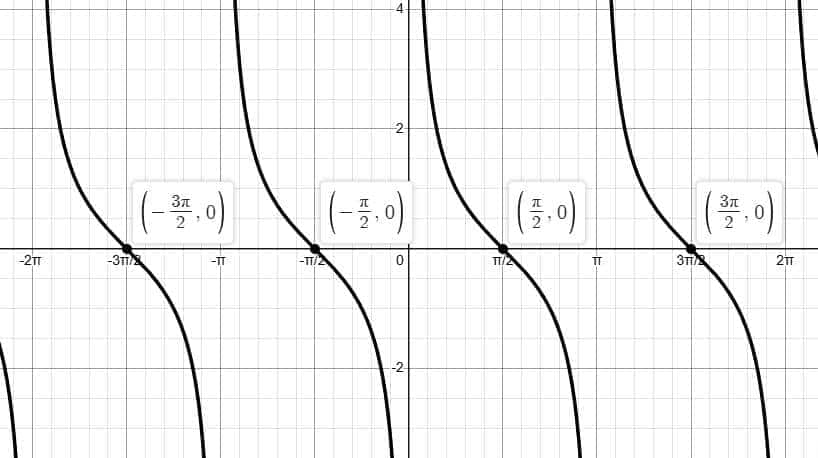
The graph of $ \cot x = \frac{1}{\tan x} $ decreases from left to right and has vertical asymptotes at $ x = n\pi $. It does not pass through the origin and repeats every $ \pi $. This function helps visualize decreasing periodic patterns in trigonometry.
Cotangent is the ratio of the length of the adjacent side (base) to the length of the opposite side (perpendicular) for a given angle.
$y = f(x) = \cot x$
In the graph of the cotangent function, angle values are plotted along the $x$-axis, and the corresponding values of $y = \cot x$ are taken on the $y$-axis.
Domain: $\mathbb{R} - \left\{ n\pi \mid n \in \mathbb{Z} \right\}$
Range: $\mathbb{R}$
Period: $\pi$
The graph repeats after every interval of $\pi$
Graph Behavior: The function decreases from $+\infty$ to $-\infty$ within each interval: $(-2\pi, -\pi)$, $(-\pi, 0)$, $(0, \pi)$, etc.
Roots: $x = \frac{n\pi}{2}$, where $n$ is an odd integer: $..., -3, -1, 1, 3, ...$
Amplitude: Undefined (graph tends to $\pm \infty$)
Vertical Asymptotes: $x = n\pi$, where $n \in \mathbb{Z}$
Line of Symmetry: Origin
Since: $\cot(-x) = -\cot x$, the function $\cot x$ is an odd function.
Key Features of Trigonometric Graphs
Provided below are the important features about the trigonometric graphs of different trigonometric ratios:
1. Amplitude and Vertical Stretch
Amplitude is the maximum vertical distance of the graph from its baseline (usually the $x$-axis or a shifted line).
It represents how tall the wave peaks or how deep the troughs go.
Applies to: Sine and Cosine functions.
For functions of the form $y = a\sin x$ or $y = a\cos x$, the amplitude is $|a|$.
If $|a| > 1$, the graph stretches vertically; if $0 < |a| < 1$, it compresses.
Note: Cosecant and Secant functions don’t have a defined amplitude because they have infinite values (asymptotes).
2. Period and Frequency
Period of a trigonometric function is the horizontal length of one complete cycle.
It indicates how frequently the function repeats itself.
Standard Periods:
$\sin x$, $\cos x$, $\sec x$, $\csc x$: period is $2\pi$
$\tan x$, $\cot x$: period is $\pi$
For functions of the form $y = \sin(bx)$ or $y = \cos(bx)$, the period becomes $\dfrac{2\pi}{|b|}$.
Frequency is the number of cycles the function completes in $2\pi$ units and is the reciprocal of the period.
3. Phase Shift and Horizontal Shift
A phase shift moves the graph left or right along the $x$-axis.
It occurs in functions like $y = \sin(bx + c)$ or $y = \cos(bx + c)$.
Phase Shift = $-\dfrac{c}{b}$
If $c > 0$, the graph shifts left; if $c < 0$, the graph shifts right.
This affects the starting point of the wave but not its shape.
4. Vertical Shift and Baseline Movement
A vertical shift moves the entire graph up or down.
It is seen in expressions like $y = \sin x + d$ or $y = \cos x + d$.
The new baseline becomes $y = d$.
If $d > 0$, the graph shifts up; if $d < 0$, it shifts down.
This changes the midline around which the graph oscillates.
5. Symmetry and Behavior in Different Quadrants
Even/Odd Nature:
$\cos x$ and $\sec x$ are even functions: symmetric about the $y$-axis
$\cos(-x) = \cos x$
$\sin x$, $\tan x$, $\cot x$, and $\csc x$ are odd functions: symmetric about the origin
$\sin(-x) = -\sin x$
Quadrantal Behavior (based on ASTC rule):
All trigonometric functions are positive in the first quadrant
Sine and cosecant are positive in the second quadrant
Tangent and cotangent are positive in the third quadrant
Cosine and secant are positive in the fourth quadrant
General Form of Trigonometric Functions
What is the general form of a trigonometric graph? While drawing a graph of the sine function, we convert the given function to the general form as $a \sin (bx – c) + d$ in order to find the different parameters such as amplitude, phase shift, vertical shift and period. Similarly, for the cosine function we can use the formula $a \cos (bx – c) + d$.
The general form of a sine (or cosine) function is:
$y = a \sin(bx + c) + d$
Where:
$|a|$ is the amplitude , the height of the wave from the midline.
$\dfrac{2\pi}{|b|}$ is the period , the length of one complete cycle.
$\dfrac{-c}{b}$ is the phase shift , the horizontal shift of the graph.
$d$ is the vertical shift , moves the graph up or down, changing the midline to $y = d$.
How to Graph a Trigonometric Function?
To graph a trigonometric function, follow the steps below:
Step 1: Convert the given trigonometric function into its general form:
$y = a \sin(bx + c) + d$
Step 2: Identify the key parameters from the equation:
Amplitude = $|a|$
Period = $\dfrac{2\pi}{|b|}$ (for sine and cosine)
Phase shift = $-\dfrac{c}{b}$
Vertical shift = $d$
Step 3: Use the appropriate formula for the period:
For sine and cosine: Period = $\dfrac{2\pi}{|b|}$
For tangent and cotangent: Period = $\dfrac{\pi}{|b|}$
Step 4: Plot the graph using the identified parameters. Start by sketching the midline at $y = d$, mark the amplitude above and below the midline, determine the start and end of one period using the phase shift and horizontal stretch, and then plot key points within the cycle to sketch the complete wave.
Transformation of the Graph of Trigonometric Functions
How do transformations affect trig graphs? Let us discuss in depth below:
1. The graph of $y = -f(x)$ from the graph of $y = f(x)$
If $f(x) > 0$, then $-f(x) < 0$, and if $f(x) < 0$, then $-f(x) > 0$.
So, the graph of $y = -f(x)$ is obtained by flipping the graph of $y = f(x)$ vertically (upside down) about the x-axis.
The period of the function does not change in this transformation.
Only the orientation (above/below the x-axis) is reversed.
2. The graph of $y = f(x) + a$ from the graph of $y = f(x)$
The graph of $y = f(x) + a$ is obtained by shifting the graph of $y = f(x)$:
Upward by $a$ units if $a > 0$
Downward by $a$ units if $a < 0$
This is a vertical translation.
The shape of the transformed graph remains the same, so the period remains unchanged,
but the range shifts up or down depending on the value of $a$.
3. The graph of $y = f(x - a)$ from the graph of $y = f(x)$
This transformation results in a horizontal shift:
Shift the graph right by $a$ units if $a > 0$
Shift the graph left by $a$ units if $a < 0$
This does not affect the amplitude or period, only the starting point of the cycle changes.
4. The graph of $y = a \cdot f(x)$ from the graph of $y = f(x)$
This transformation causes a vertical stretch or compression:
If $|a| > 1$, the graph is stretched vertically (taller peaks and deeper troughs)
If $0 < |a| < 1$, the graph is compressed vertically
If $a < 0$, there is a vertical reflection as well
The amplitude becomes $|a|$ (for sine or cosine).
The period remains unchanged.
5. The graph of $y = f(bx)$ from the graph of $y = f(x)$
This transformation causes a horizontal compression or stretch:
If $|b| > 1$, the graph is compressed horizontally
If $0 < |b| < 1$, the graph is stretched horizontally
The new period is:
For sine and cosine: $\dfrac{2\pi}{|b|}$
For tangent and cotangent: $\dfrac{\pi}{|b|}$
Shifted Trigonometric Function
A shifted trig function refers to a trigonometric graph that has been moved horizontally or vertically from its standard position. These shifts help model real-world wave patterns and periodic behavior more accurately.
For a general trigonometric function of the form:
$y = a \sin(bx + c) + d \quad \text{or} \quad y = a \cos(bx + c) + d$ the shifts are described as follows:
Horizontal shift (phase shift): Determined by the value of $c$, and calculated as $\dfrac{-c}{b}$. If $c > 0$, the graph shifts left; if $c < 0$, it shifts right.
Vertical shift: Controlled by $d$, which moves the graph up if $d > 0$ and down if $d < 0$.
These modifications result in shifted trig function graphs that maintain the same shape but change position on the coordinate plane.
Understanding how to graph a shifted sine, cosine, or tangent function is crucial when studying the transformation of trig graphs, especially in analysing periodicity of trigonometric functions, amplitude changes, and real-world modelling.
Which Trigonometric Functions have asymptotes?
Trigonometric functions that have asymptotes are those that are undefined at certain points due to division by zero. These include:
Tangent function ($\tan x$):
Has vertical asymptotes at
$x = \dfrac{\pi}{2} + n\pi,\quad n \in \mathbb{Z}$
because $\tan x = \dfrac{\sin x}{\cos x}$ becomes undefined when $\cos x = 0$.Cotangent function ($\cot x$):
Has vertical asymptotes at
$x = n\pi,\quad n \in \mathbb{Z}$
since $\cot x = \dfrac{\cos x}{\sin x}$ becomes undefined when $\sin x = 0$.Secant function ($\sec x$):
Has vertical asymptotes at
$x = \dfrac{\pi}{2} + n\pi,\quad n \in \mathbb{Z}$
because $\sec x = \dfrac{1}{\cos x}$ is undefined when $\cos x = 0$.Cosecant function ($\csc x$):
Has vertical asymptotes at
$x = n\pi,\quad n \in \mathbb{Z}$
since $\csc x = \dfrac{1}{\sin x}$ is undefined when $\sin x = 0$.
These asymptotes are reflected as vertical lines on the graphs of these functions, indicating points where the function shoots toward positive or negative infinity.
Domain and Range of Trigonometric Functions
Below given are the domain and range of various trigonometric functions such as $\sin x, \cos x$:
Function | Domain | Range |
Sine ($\sin x$) | $x \in \mathbb{R}$ | $[-1, 1]$ |
Cosine ($\cos x$) | $x \in \mathbb{R}$ | $[-1, 1]$ |
Tangent ($\tan x$) | $x \in \mathbb{R} - \left\{ \dfrac{\pi}{2} + n\pi \mid n \in \mathbb{Z} \right\}$ | $\mathbb{R}$ |
Cotangent ($\cot x$) | $x \in \mathbb{R} - \left\{ n\pi \mid n \in \mathbb{Z} \right\}$ | $\mathbb{R}$ |
Secant ($\sec x$) | $x \in \mathbb{R} - \left\{ \dfrac{\pi}{2} + n\pi \mid n \in \mathbb{Z} \right\}$ | $(-\infty, -1] \cup [1, \infty)$ |
Cosecant ($\csc x$) | $x \in \mathbb{R} - \left\{ n\pi \mid n \in \mathbb{Z} \right\}$ | $(-\infty, -1] \cup [1, \infty)$ |
Graph Transformations in Trigonometric Functions
Graph transformations in trigonometric functions help us understand how changes in amplitude, period, phase shift, and vertical shift affect the shape and position of sine, cosine, and other trigonometric graphs.
Transformation | Equation | Effect on Graph | Changes |
Vertical Reflection | $y = -f(x)$ | Flips graph upside down | Sign of $y$-values reverses, period remains the same |
Vertical Shift | $y = f(x) + a$ | Shifts graph up/down | Shift up if $a > 0$, down if $a < 0$; period unchanged |
Horizontal Shift (Phase Shift) | $y = f(x - a)$ | Shifts graph left/right | Shift right if $a > 0$, left if $a < 0$ |
Vertical Stretch/Compression | $y = a \cdot f(x)$ | Changes amplitude | Stretch |
Horizontal Stretch/Compression | $y = f(bx)$ | Changes period | |
General Form | $y = a \cdot f(bx + c) + d$ | Combines all transformations (stretch, shift, flip) |
Real-World Applications of Trigonometric Graphs
Trigonometric functions go far beyond textbook problems,they model real phenomena in science, engineering, and nature.
Applications in Physics: Waves and Harmonic Motion
Trigonometric functions like $y = \sin x$ and $y = \cos x$ describe simple harmonic motion in pendulums, springs, and sound waves.
The general equation for a wave is:
$y = A \sin(\omega t + \phi)$
where:$A$ is amplitude
$\omega$ is angular frequency
$t$ is time
$\phi$ is phase shift
This model is used in light waves, AC electricity, and vibration systems.
Applications in Engineering and Signal Processing
In electrical engineering, trigonometric graphs model alternating current (AC) and modulation in communication systems.
Fourier analysis decomposes complex signals into sums of sine and cosine waves.
Used in robotics for calculating angles in mechanical arms, and in civil engineering for modeling structures under periodic stress.
Use in Periodic Patterns and Modelling
Weather cycles, ocean tides, and seasonal temperatures can be modeled using sine/cosine graphs.
In music theory, trigonometric graphs help visualize sound frequencies and harmonics.
In biology, circadian rhythms and heartbeat patterns exhibit periodic behavior suited to trigonometric modeling.
Solved Examples Based on the Graph of Trigonometric Function
Example 1: What is the solution set of the equation $\csc x>1$ in the interval $[0,2 \pi$ ]?
Solution:
Cosecant Function
$y=f(x)=\operatorname{cosec}(x)$
Domain is R - $\{\mathrm{n} \pi, \mathrm{n} \in \mathrm{I}$ (Integers) $\}$
Range is $\mathrm{R}-(-1,1)$
Period is $2 \pi$
As seen in the graph the graph is always on or above the line $x=1$ or below the line $x$ $=-1$
Thus $\operatorname{cosec} \mathrm{x}>1$ will be $x \epsilon[0,2 \pi]-\{\pi / 2,3 \pi / 2\}$ because at $\mathrm{x}=\pi / 2,3 \pi / 2$; $\operatorname{cosec} x=1$
Example 2: What is the range of $f(x)=\sin|3x^3| \ \ x\epsilon R$?
Solution: Graph of sine function
y = f(x) = sin(x)
Now,
$f(x)=\sin \left|3 x^3\right|, \quad x \in R$
$\text { assume }\left|3 x^3\right|=t, \quad t \geq 0$
Now, from graph if $t \geq 0$, then $y=\sin (t)$ takes all values in $[-1,1]$ So, range is $[-1,1]$.
Example 3: The number of solutions of $\sin 3x = \cos 2x$, in the interval $\left(\frac{\pi}{2}, \pi\right)$ is: [JEE MAINS 2018]
Solution: We are given the equation: $\sin 3x = \cos 2x$
Using the identity: $\cos \theta = \sin\left(\frac{\pi}{2} - \theta\right)$
We rewrite the equation as: $\sin 3x = \sin\left(\frac{\pi}{2} - 2x\right)$
Now using the identity: If $\sin A = \sin B$, then
$A = B + 2n\pi$ or $A = \pi - B + 2n\pi$
Case 1: $3x = \frac{\pi}{2} - 2x + 2n\pi$
$\Rightarrow 5x = \frac{\pi}{2} + 2n\pi$
$\Rightarrow x = \frac{\pi + 4n\pi}{10}$
Case 2: $3x = \pi - \left(\frac{\pi}{2} - 2x\right) + 2n\pi$
$\Rightarrow 3x = \frac{\pi}{2} + 2x + 2n\pi$
$\Rightarrow x = \frac{\pi}{2} + 2n\pi$
Now find values of $x$ in the interval $\left(\frac{\pi}{2}, \pi\right)$
From Case 1: $x = \frac{(1 + 4n)\pi}{10}$
Try $n = 1$: $x = \frac{5\pi}{10} = \frac{\pi}{2}$ excluded
Try $n = 2$: $x = \frac{9\pi}{10} \in \left(\frac{\pi}{2}, \pi\right)$
Try $n = 3$: $x = \frac{13\pi}{10} > \pi$ not allowed
From Case 2: $x = \frac{\pi}{2} + 2n\pi$ all values exceed $\pi$ in the interval
So, only one solution exists.
Hence, the number of solutions is $1$.
Example 4: If $f(x)= 4\cos\theta+\sin^2\theta$ Which of the following is true for f(x)?
a) At $\theta=0$ $f(x)$ has its maximum value and maximum value of $f(x)$ is $5$
b) At $\theta=\pi$ $f(x)$ has its minimum and minimum value of $f(x)$ is $-5$
c) At $\theta=\pi$ $f(x)$ has its minimum value and minimum value of $f(x)$ is -4
d) At $\theta=0$ $f(x)$ has its minimum value and minimum value of $f(x)$ is 1
Solution: Cosine Function
y = f(x)= cos(x)
Domain is R
Range is [-1, 1]
$\begin{aligned} & f(x)=4 \cos \theta+\sin ^2 \theta \\ = & 4 \cos \theta+1-\cos ^2 \theta \\ = & 5-\left(\cos ^2-4 \cos \theta+4\right) \\ = & 5-(\cos \theta-2)^2\end{aligned}$
minimum value of f(x) at $\theta=\pi$
f(x)min=$5-9=-4$
maximum value of$ f(x)$ at $\theta=0$
f(x)max=5-1=4
Hence, the correct answer is the option (3).
Solution: $f(x)=\sqrt{9+\sqrt{\left(1+\cot ^2 x\right)}}$
$=\sqrt{9+\sqrt{\left(\csc ^2 x\right)}}$
$=\sqrt{9+|\csc (x)|}$
$\text { Range of } \csc (x) \text { is }(-\infty,-1] \cup[1, \infty)$
$\text { So, }|\csc (x)| \geq 1$
$f(x) \geq \sqrt{10}$
$f(x) \epsilon[\sqrt{10}, \infty)$
List of Topics Related to the Trigonometric Functions
Trigonometric functions form the foundation of many concepts in mathematics and physics. This section provides a comprehensive list of key topics,including identities, transformations, inverse functions, and applications,that are essential for mastering the subject and excelling in competitive exams.
NCERT Resources
Mastering Trigonometric Functions from NCERT Class 11 Chapter 3 is key to understanding the graphs of trigonometric functions, identities, and formulas. This section includes structured notes, solved examples, and practice problems on the graph of sin(x), cos(x), tan(x), amplitude and phase shift in trigonometry, and the periodicity of trigonometric functions,all aligned with the latest syllabus for CBSE and competitive exams.
NCERT Class 11 Chapter 3 Trigonometric Functions Notes
Practice Questions on Graphs of Trigonometric Functions
These practice questions focus on the graphs of trigonometric functions, including the sine, cosine, tangent graph and the graphs of sec, cosec, and cot functions. You'll explore the general form of trigonometric functions, amplitude and phase shift in trigonometry, and the periodicity of trigonometric functions. Learn how to draw trigonometric graphs and understand how transformations affect trig graphs, especially in shifted trig function graphs.
Graphs Of General Trigonometric Functions - Practice Now
We have provided the list of practice questions based on the following topics:
Frequently Asked Questions (FAQs)
$\sin (x+90)=\cos x$. So, the $\cos x$ graph is drawn by shifting the $\sin x$ graph by 90 degrees.
Domain is $\mathbb{R}-\left\{\frac{(2 \mathrm{n}+1) \pi}{2}, \mathrm{n} \in \mathbb{I}\right\}$
The range is $R-(-1,1)$
Period is $2 \pi$
The graph of $y=-f(x)$ from the graph of $y=f(x)$
Clearly, $f(x)>0$ when $f(x)<0$ and $-f(x)<0$ when $f(x)>0$.
So, graph $f y=-f(x)$ is obtained by flipping the graph of $y=f(x)$ upside down.
The period of function does not change in such transformation.
Domain is R
Range is $[-1,1]$
We observe that $\sin x$ completes one full cycle of its possible values (from -1 to 1 ) in the interval of length $2 \pi$. So, the period of $\sin x$ is $2 \pi$.
The graph goes from negative to positive infinity.So,Period $=180$ degree $=\pi$
The graph goes from negative to positive infinity. So, The amplitude is undefined as the graph tends to infinity.